Ludwigia peploides Growth Rate: How Fast Does It Spread?
Quantitative data on stem elongation rates, biomass accumulation, and canopy expansion of Ludwigia peploides under field and experimental conditions — understanding the speed that makes it so difficult to contain.
The extraordinary growth capacity of Ludwigia peploides is central to its invasive success and its ecological impact. Understanding how fast it grows — in terms of individual stem elongation, canopy expansion, and biomass accumulation — provides the biological context for why rapid detection and response is so critical, and why management programs must be sustained over multiple years. This article presents quantitative growth rate data from field and experimental studies. For how growth rate connects to infestation spread, see Invasive Spread Patterns. For reproductive biology, see Reproduction Cycle.
Stem Elongation Rates
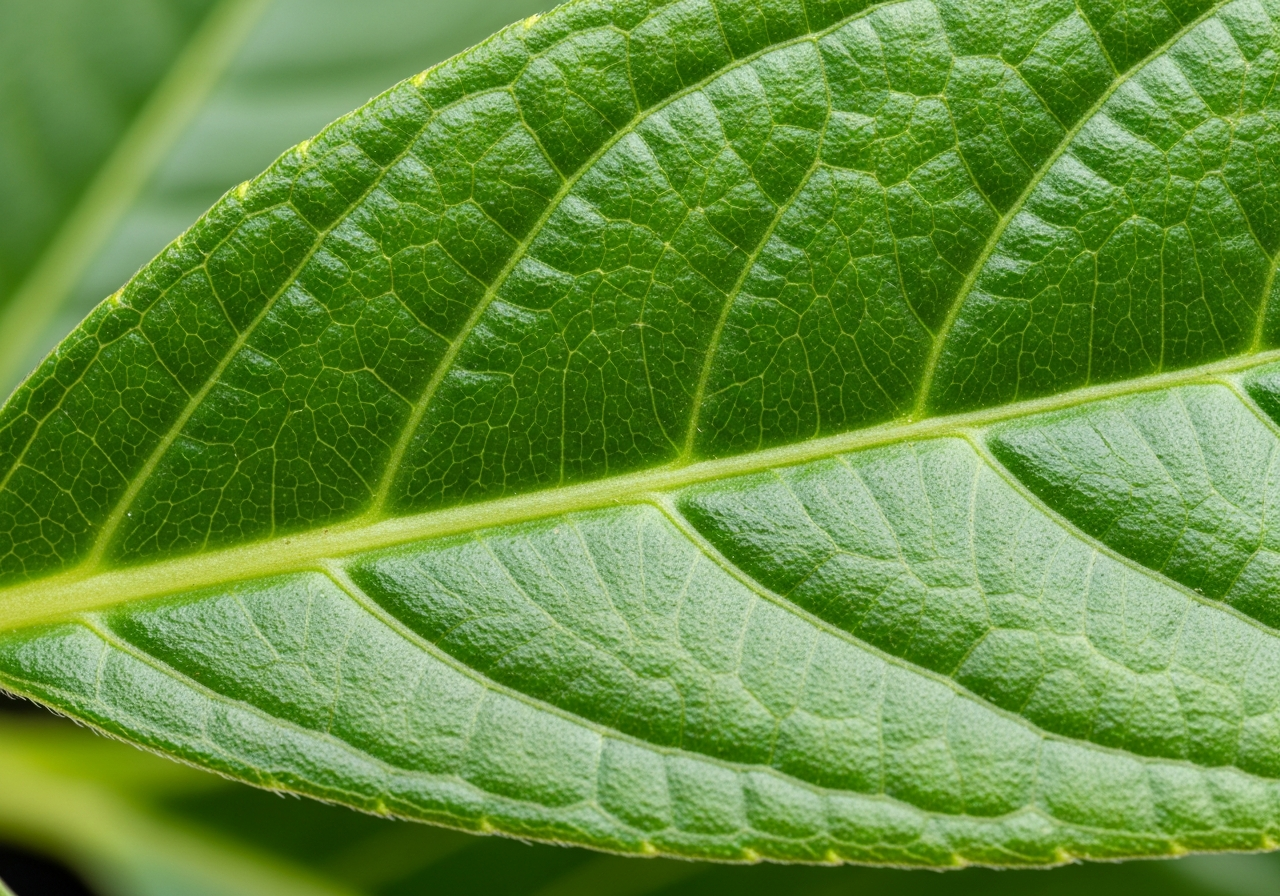
Individual stem elongation — the rate at which growing shoot tips extend across the water surface — is the most directly observable component of Ludwigia growth. Published field measurements and greenhouse experiments document stem elongation rates of 3–15 cm per day in optimal conditions, with rates at the upper end of this range observed during peak growth in warm, nutrient-rich water at temperatures of 25–30°C. At 10 cm per day, a single stem elongates by 1 meter in 10 days. Since multiple lateral branches develop from each node as stems grow, growth is exponential rather than linear — a single plant in its first month of growth may produce 10–50 stem tips, each elongating at rates in this range, resulting in very rapid aerial coverage. The high elongation rates are maintained by efficient photosynthesis under high light conditions and by rapid carbon allocation from the stem's extensive chlorophyll-rich cortex.
Biomass Accumulation
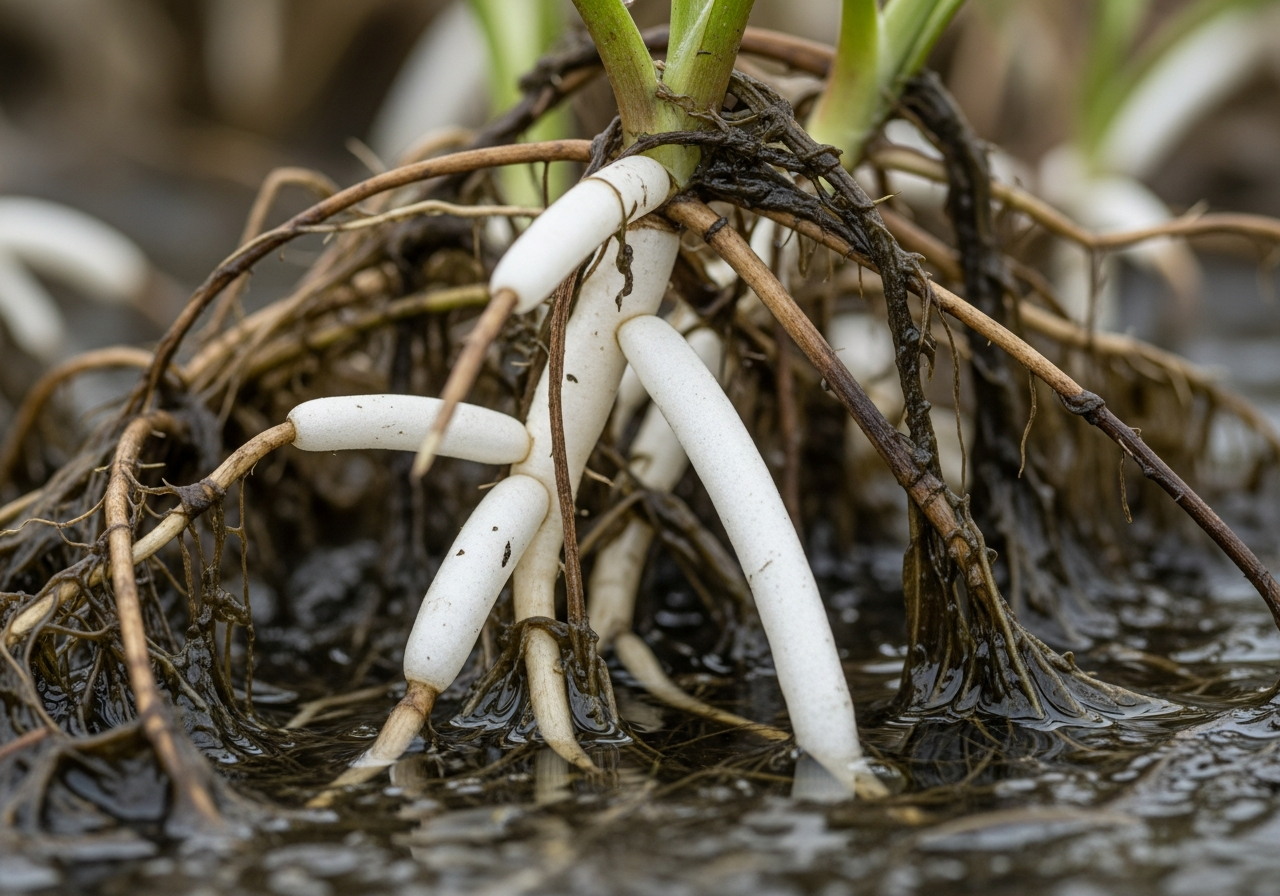
Ludwigia peploides is among the most productive freshwater macrophytes documented in the scientific literature. Above-ground biomass accumulation in field conditions reaches peak values of 2–5 kg per m² wet weight (200–500 g/m² dry weight) in established mats at peak summer growth — values comparable to highly productive agricultural crops. Below-ground biomass (root crowns, fibrous roots) can add an additional 20–40% of above-ground dry weight. Total seasonal biomass production at the scale of a 1-hectare infestation can exceed 200 tonnes wet weight — a volume that creates significant management challenges in terms of biomass removal, transport, and disposal. This extraordinary productivity reflects the combination of high light use efficiency, efficient nutrient uptake from eutrophic water, and the architectural advantage of the floating mat habit that positions all photosynthetic tissue in the optimal light environment at the water surface.
Canopy Expansion
At the population level, the expansion of Ludwigia mat area is documented through repeat aerial photography, drone surveys, and GPS-mapped field surveys. Published growth rates from California Delta management surveys and French river management records consistently document annual area expansion of 20–40% of current infestation area per growing season in the absence of management — implying a doubling time of 2–4 years at lower growth rates and less than one year at higher rates. In exceptional years with warm temperatures, high nutrient loading, and minimal management, expansion rates exceeding 50% per season have been documented. These rates highlight why management programs that reduce infestation area by 30–50% per year through treatment are essential for sustained population suppression — without at least matching or exceeding the natural expansion rate, the managed area grows rather than shrinks.
Temperature Effects on Growth
Water temperature is the dominant abiotic control on Ludwigia peploides growth rate. Published growth-temperature response curves show: (1) minimal growth below approximately 10°C; (2) rapidly increasing growth from 12–25°C; (3) maximum growth rates in the 25–30°C range; and (4) reduced growth at temperatures above 35°C due to heat stress. This thermal response means that sites with warm summer temperatures sustain the highest growth rates and most aggressive invasions. The importance of temperature also means that climate warming — projected to increase mean summer water temperatures in many invaded regions — will likely increase growth rates and expand the geographic range over which maximum growth potential is achievable. For climate change projections, see Climate Change and Ludwigia peploides.
Nutrient Effects on Growth
Nutrient availability — particularly nitrogen and phosphorus — strongly affects Ludwigia growth rates. Eutrophic water bodies (with total nitrogen >1 mg/L and total phosphorus >0.1 mg/L) support dramatically faster growth than oligotrophic or mesotrophic systems. Published comparisons of Ludwigia growth in water bodies with different nutrient levels show 3–8× higher biomass production in eutrophic vs oligotrophic conditions. The extensive agriculture, urban stormwater, and wastewater discharges that enrich many invaded water bodies with nitrogen and phosphorus create near-optimal growing conditions. This creates a troubling feedback: cultural eutrophication (nutrient enrichment from human activities) is both a major global environmental problem and a major enabler of aquatic invasive plant growth. Addressing nutrient enrichment is therefore not just a water quality goal in its own right, but also an invasive plant management strategy that reduces the growth potential of Ludwigia populations.
Conclusion
The growth rate of Ludwigia peploides — up to 15 cm per day stem elongation, 5 kg/m² peak biomass, and 20–40% annual area expansion — is among the highest documented for any aquatic macrophyte and is a primary driver of its ecological impact and management difficulty. These growth rates set the minimum standard for management effort: programs that cannot match or exceed the natural expansion rate will see populations grow despite treatment. Early detection — allowing management to begin when populations are small and per-unit growth adds less to total infestation size — is therefore the most cost-effective investment. See our Early Stage Identification guide for detection methods and our Cost of Inaction analysis for the economics of delay.